
Understanding P/E Ratio: A Comprehensive Guide for Investors
Introduction
Investors navigating the complex world of financial markets often rely on various metrics to make informed decisions. One such crucial indicator is the Price-to-Earnings (P/E) ratio, a fundamental tool that provides valuable insights into a company’s valuation and potential for growth. In this comprehensive guide, we will unravel the intricacies of P/E ratios, explore their significance in stock valuation, and equip you with the knowledge needed to incorporate this metric into your investment strategy.
I. Definition of P/E Ratio

The Price-to-Earnings ratio is a valuation metric that measures the relationship between a company’s stock price and its earnings per share (EPS). It is calculated by dividing the market price per share by the earnings per share. The formula is simple:

This ratio serves as a key indicator of how the market values a company’s stock in relation to its earnings. A high P/E ratio may suggest that investors expect higher future growth, while a low P/E ratio might indicate lower growth expectations or undervaluation.
Importance of P/E Ratio in Investment
Understanding the P/E ratio is crucial for investors for several reasons. Firstly, it provides insights into the market’s perception of a company’s future earnings potential. A high P/E ratio could signify confidence in a company’s growth prospects, while a low P/E ratio might suggest skepticism or concerns.
Secondly, the P/E ratio serves as a benchmark for comparing different stocks or assessing a stock’s valuation relative to its historical performance. Investors often use P/E ratios to make informed decisions about buying or selling stocks, forming an integral part of their investment strategy.
II. How to Calculate P/E Ratio

A. Formula Breakdown
Breaking down the P/E ratio formula is essential for investors to grasp its components fully. The market price per share is the current trading price of a company’s stock, readily available on financial platforms. On the other hand, earnings per share (EPS) is derived from the company’s net income divided by its outstanding shares.
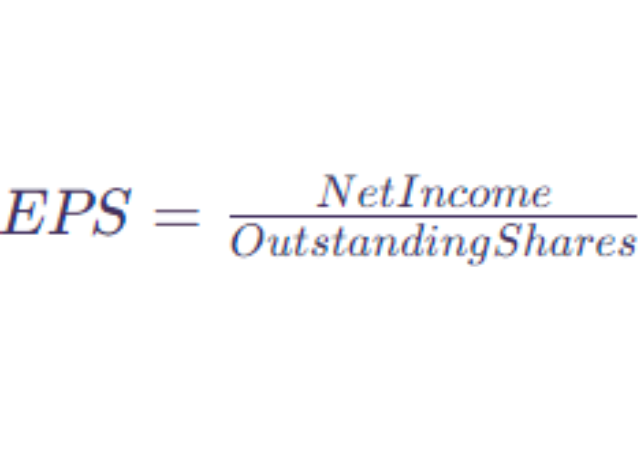
By plugging in these values, investors can calculate the P/E ratio and gain insights into how the market values a company’s earnings.
B. Interpretation of Results
Interpreting the P/E ratio involves understanding the context of the company and the industry. A high P/E ratio may signal market expectations of robust future growth, but it also carries the risk of overvaluation. Conversely, a low P/E ratio may indicate undervaluation, but it could also reflect concerns about the company’s performance.
C. Different Types of P/E Ratios
There are variations of P/E ratios, each offering a nuanced perspective on valuation:
- Trailing P/E Ratio: Based on historical earnings, this ratio considers the last four quarters’ earnings per share.
- Forward P/E Ratio: Projecting future earnings, this ratio provides insights into expected performance.
- PEG Ratio (Price/Earnings to Growth): Combining P/E ratio with earnings growth, the PEG ratio offers a more holistic view of valuation.
III. Significance of P/E Ratio in Stock Valuation

A. Relationship with Earnings Growth
The P/E ratio is inherently linked to a company’s earnings growth. Investors often prefer companies with a reasonable P/E ratio that aligns with their growth expectations. A balance between a moderate P/E ratio and consistent earnings growth is indicative of a well-positioned investment opportunity.
B. Comparison with Industry Averages
To assess a company’s P/E ratio effectively, investors should compare it to industry averages. Variations in P/E ratios across sectors can be substantial due to industry-specific factors. Understanding these variations helps investors identify whether a stock is overvalued or undervalued relative to its peers.
C. P/E Ratio and Market Sentiment
The P/E ratio also reflects market sentiment. In bullish markets, investors may be more willing to pay a premium for high-growth stocks, leading to elevated P/E ratios. Conversely, in bearish markets, investors may seek value and gravitate towards stocks with lower P/E ratios.
IV. Factors Affecting P/E Ratio

A. Earnings Stability
Companies with consistent and stable earnings often command higher P/E ratios. Investors perceive earnings stability as a sign of reliability and are willing to pay a premium for the predictability of future earnings.
B. Growth Prospects
High-growth companies typically have higher P/E ratios as investors anticipate substantial future earnings. However, the challenge lies in distinguishing between sustainable growth and overly optimistic expectations.
C. Risk and Volatility
Companies operating in volatile industries or facing significant risks may have lower P/E ratios. Investors may be cautious about paying a premium for stocks with uncertain future earnings.
D. Market Conditions
Macro-economic factors and overall market conditions can influence P/E ratios. During economic downturns, P/E ratios may contract as investors become more risk-averse, while bull markets may see inflated P/E ratios.
V. Analyzing High and Low P/E Ratios

A. High P/E Ratios: Overvalued or Growth Opportunity?
High P/E ratios often raise questions about overvaluation, but they can also indicate market confidence in a company’s growth potential. Investors should delve deeper into the company’s fundamentals, considering its growth trajectory, competitive landscape, and industry trends.
B. Low P/E Ratios: Undervalued or Warning Sign?
While low P/E ratios may suggest undervaluation, investors must assess whether the low valuation is justified. It could be a buying opportunity or an indication of underlying issues such as poor performance or bleak growth prospects.
VI. P/E Ratio and Sector Analysis

A. Variances in P/E Ratios across Industries
Different industries exhibit distinct P/E ratio ranges influenced by their unique characteristics. Understanding these variations is crucial for accurate sector analysis and comparison.
B. Understanding Sector-specific Factors
Certain sectors, like technology, may command higher P/E ratios due to rapid innovation and growth potential, while more mature industries may have lower average P/E ratios.
VII. Limitations and Criticisms of P/E Ratio

A. Ignoring Growth Potential
Critics argue that P/E ratios may overlook a company’s growth potential, particularly for young and innovative firms. Relying solely on P/E ratios may lead to missed investment opportunities.
B. Accounting for Non-Recurring Items
P/E ratios may be distorted by one-time events or non-recurring items affecting a company’s earnings. Investors should be cautious and consider adjusting for such anomalies.
C. Cyclical Nature of Businesses
Businesses in cyclical industries may experience fluctuations in earnings, impacting their P/E ratios. Investors must account for these cyclical patterns to make accurate assessments.
VIII. Case Studies

A. Examining P/E Ratios of Well-known Companies
Analyzing P/E ratios of well-established companies offers practical insights. Case studies can highlight how market conditions, industry dynamics, and company-specific factors influence P/E ratios over time.
B. Lessons Learned from Historical P/E Trends
Reviewing historical P/E trends can provide valuable lessons for investors. Understanding how a company’s P/E ratio has evolved during different market conditions can inform future investment decisions.
IX. Using P/E Ratio in Investment Strategies

A. Incorporating P/E Ratio in Decision-Making
Investors should integrate P/E ratios into their broader decision-making process. Combining P/E ratios with other financial metrics provides a more comprehensive view of a company’s financial health.
B. Balancing P/E Ratio with Other Financial Metrics
While P/E ratio is a powerful tool, it should not be the sole determinant of investment decisions. Combining it with metrics like debt levels, cash flow, and return on equity enhances the accuracy of investment evaluations.
X. Future Trends in P/E Ratio Analysis

A. Technological Advancements
Advancements in financial technology may introduce new tools and models for P/E ratio analysis, providing investors with more sophisticated and accurate insights.
B. Evolving Market Dynamics
As markets evolve, so do the factors influencing P/E ratios. Investors must stay attuned to changing dynamics, such as shifts in consumer behavior, regulatory changes, and global economic trends.
Conclusion

My name is Rohit Vagh and I’m a content writer specializing in fashion and lifestyle. I have three years of experience in this field and have written various articles. My writing style is creative and engaging, and I strive to create content that resonates with my readers. I have a deep passion for fashion and am constantly researching the latest trends and styles to make sure my readers are up to date. I’m excited to continue my career in blogging, and I’m always looking for new opportunities in the fashion and lifestyle space.